Dive into the findings below:
eDNA technology offers a non-invasive, replicable, and observer-independent method for monitoring biodiversity.
However, “eDNA” now refers to a wide range of protocols that vary greatly in sophistication – raising a critical question: are they all equally effective?
To explore this, we compared SPYGEN’s standard protocol for freshwater environments (30 L, 12 PCR replicates, 500K reads) with a simulated result of a basic protocol (2 L of water filtered, 8 PCR replicates, 100K reads) in a real river site in Germany.
- 33% of species went undetected and
- 67% of threatened species were missed with the basic protocol.
Why this matters?
Rigorous eDNA technologies are crucial. Inadequate methods may overlook rare species of high conservation or scientific value, resulting in misleading data and flawed conservation, management, or scientific conclusions.
When comparing eDNA protocols, keep in mind these 3 key elements:
- Sampling strategy matters: because eDNA is highly localized, filtering larger water volumes along integrated transects (vs. fixed points) captures more eDNA, providing a more complete and accurate biodiversity snapshot of the site.
- PCR replicates increase detection probability: using 12 PCR replicates means amplifying DNA in 12 independent subsamples, significantly boosting detection rates and minimizing false negatives, especially when paired with our high-performance primers.
- Sequencing depth drives detection power: The more DNA strands sequenced, the greater the chance of detecting and identifying species. Analyzing 500,000 DNA reads greatly improves the detection of rare and low-abundance species, up to 5x more than standard 100,000-reads approaches.
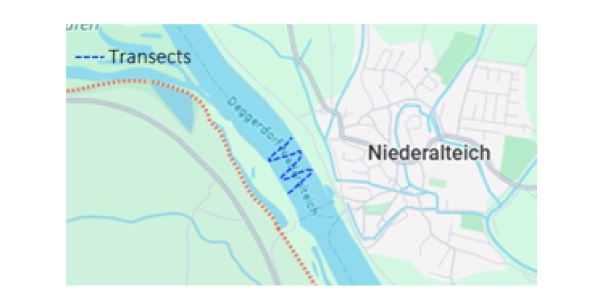
Sampling approach
Location: Niederaltaich (Germany).
Ecosystem: Danube River.
Sampling method: Filtering 30 L of freshwater using SPYGEN high-capacity filters on a boat moving from side to side.
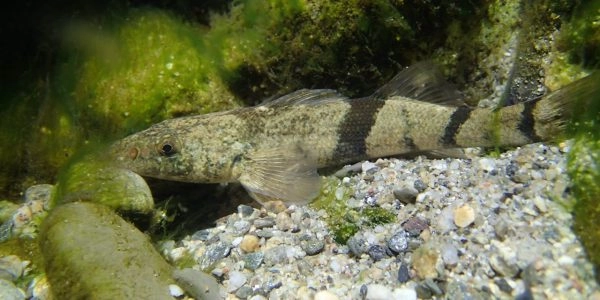
Taxonomic group: fishes, via SPYGEN’s teleo primer.
Species and corresponding detected sequencing reads: see below.
| Common Name | Scientific Name | IUCN Status | SPYGEN Protocol Liters of Water Filtered = 30 L No of PCR Replicates = 12 Sequencing Depth = 500 thousand |
Basic Protocol Liters of Water Filtered = 2 L No of PCR Replicates = 8 Sequencing Depth = 100 thousand |
|---|---|---|---|---|
| Common bream | Abramis brama | LC | 50,422 | 10,084 |
| Bleak | Alburnus alburnus | LC | 36,585 | 7,317 |
| Asp | Aspius aspius | LC | 2,132 | 426 |
| Barbel | Barbus barbus | LC | 63,428 | 12,686 |
| Vimba bream | Bsapa_Bbjoernkna_Vvimba | LC | 3,991 | 798 |
| White-finned gudgeon | Ggobio_Ralbipinnatus | LC | 3,848 | 770 |
| Ide / Common dace / Bleak | Lidus_Lleuciscus_Pcultratus | LC | 3,755 | 751 |
| Roach | Rutilus rutilus | LC | 13,944 | 2,789 |
| Danube roach | Rutilus virgo | LC | 6,417 | 1,283 |
| European chub | Squalius cephalus | LC | 2,694 | 539 |
| European perch | Perca fluviatilis | LC | 1,365 | 273 |
| Schneider / Spirlin | Alburnoides bipunctatus | LC | 698 | Not Detected |
| Danube gudgeon | Romanogobio uranoscopus | LC | 23 | Not Detected |
| Stone loach | Barbatula barbatula | LC | 155 | Not Detected |
| Ruffe | Gymnocephalus sp. | LC | 872 | Not Detected |
| Pike-perch / Zander | Sander sp. | LC | 328 | Not Detected |
| Streber | Zingel streber | LC | 364 | Not Detected |
| Brown trout | Salmo trutta | LC | 287 | Not Detected |
| Pumpkinseed | Lepomis gibbosus | INVASIVE | 2,266 | 453 |
| Racer goby | Babka gymnotrachelus | INVASIVE | 1,891 | 378 |
| Round goby | Neogobius melanostomus | INVASIVE | 8,868 | 1,774 |
| Bighead goby | Ponticola kessleri | INVASIVE | 4,827 | 965 |
| Tubenose goby | Proterorhinus semilunaris | INVASIVE | 2,632 | 526 |
| Nase / Souffia | Cnasus_Tsouffia | NT/LC | 7,705 | 1,541 |
| Italian roach / Pigus roach | Rutilus pigus | VU | 5,360 | 1,072 |
| Sterlet | Acipenser ruthenus | EN | 22 | Not Detected |
| European eel | Anguilla anguilla | CR | 52 | Not Detected |
This comparison is based on a simulated outcome derived from linear modelling of a simplified eDNA protocol and is intended for illustrative purposes only. It does not reflect the validated protocols of any specific provider. The aim is to demonstrate how key methodological parameters, such as water volume, number of PCR replicates, and sequencing depth, affect detection power and how easily species, including threatened ones, can be missed when protocols are underpowered.
The model evaluates expected species detection loss due to successive reductions in: (i) filtered water volume from 30 L to 2 L (15×), (ii) PCR replicates from 12 to 8 (1.5×), and (iii) sequencing depth from 500,000 to 100,000 reads (5×), all leading to reduction in usable eDNA signal. Estimated species loss is calculated based on the probability of falling below a detection threshold of 10 unique reads per species, used to avoid false positives. This is a theoretical exercise intended solely to illustrate general methodological considerations. It is not intended to evaluate, criticize, or compare the performance of any specific commercial provider.
Spygen’s standard protocol for marine and freshwater environments foresees filtering 30 liters of water per filter, with 2 filters used on the same site (i.e., 60 liters filtered in the same integrative transect), empirical experiences indicates that this approach further enhances detection power.